NOC Intelligence


Network monitoring tools captured every metric. But they missed 40–50% of operators' work: manually correlating data across 5 fragmented systems.
System connects what operators did manually
20–30 min advance notice before failures
Matches support to operator expertise
Collaborated with Project Manager, Interaction Designer, and Visual Designer on multidisciplinary teams at UXReactor.
I redesigned network operations tools for Nokia, Extreme Networks, and VMware. Observed 24 operators and discovered they spent 40–50% of their time on invisible work: manually correlating data across fragmented systems. Designed a unified workspace that automates correlation, preserves context, and adapts to operator expertise. Validated with operators monitoring 32M live subscribers.
Impact: 15× efficiency improvement, 2× faster diagnosis, proactive prevention replacing reactive firefighting.

Efficiency improvement matters because the problem scales across an entire industry. In network operations centers (NOCs), where operators monitor and maintain critical infrastructure for telecom providers and large enterprises, much of the work happens across fragmented tools and systems. The inefficiencies I observed, operators spending half their time on invisible work, affect 50,000+ network operators globally. These teams are responsible for keeping always-on infrastructure running, supporting hospitals, banks, telecoms, governments, and manufacturers that rely on 24/7/365 uptime.
Additionally, 5G rollout requires 3–5× monitoring complexity, while IoT introduces millions of additional endpoints. Reactive-only systems don’t scale in this environment. A unified, predictive approach enables next-generation infrastructure.
Clients knew something was broken.
But their understanding was surface-level…
"By the time we get the data, the customer's already called in angry."
"Our juniors are checking every single metric. They need better training and clearer alerts."
"Five systems, manual correlation each time. We need consolidation but don't know where to start."
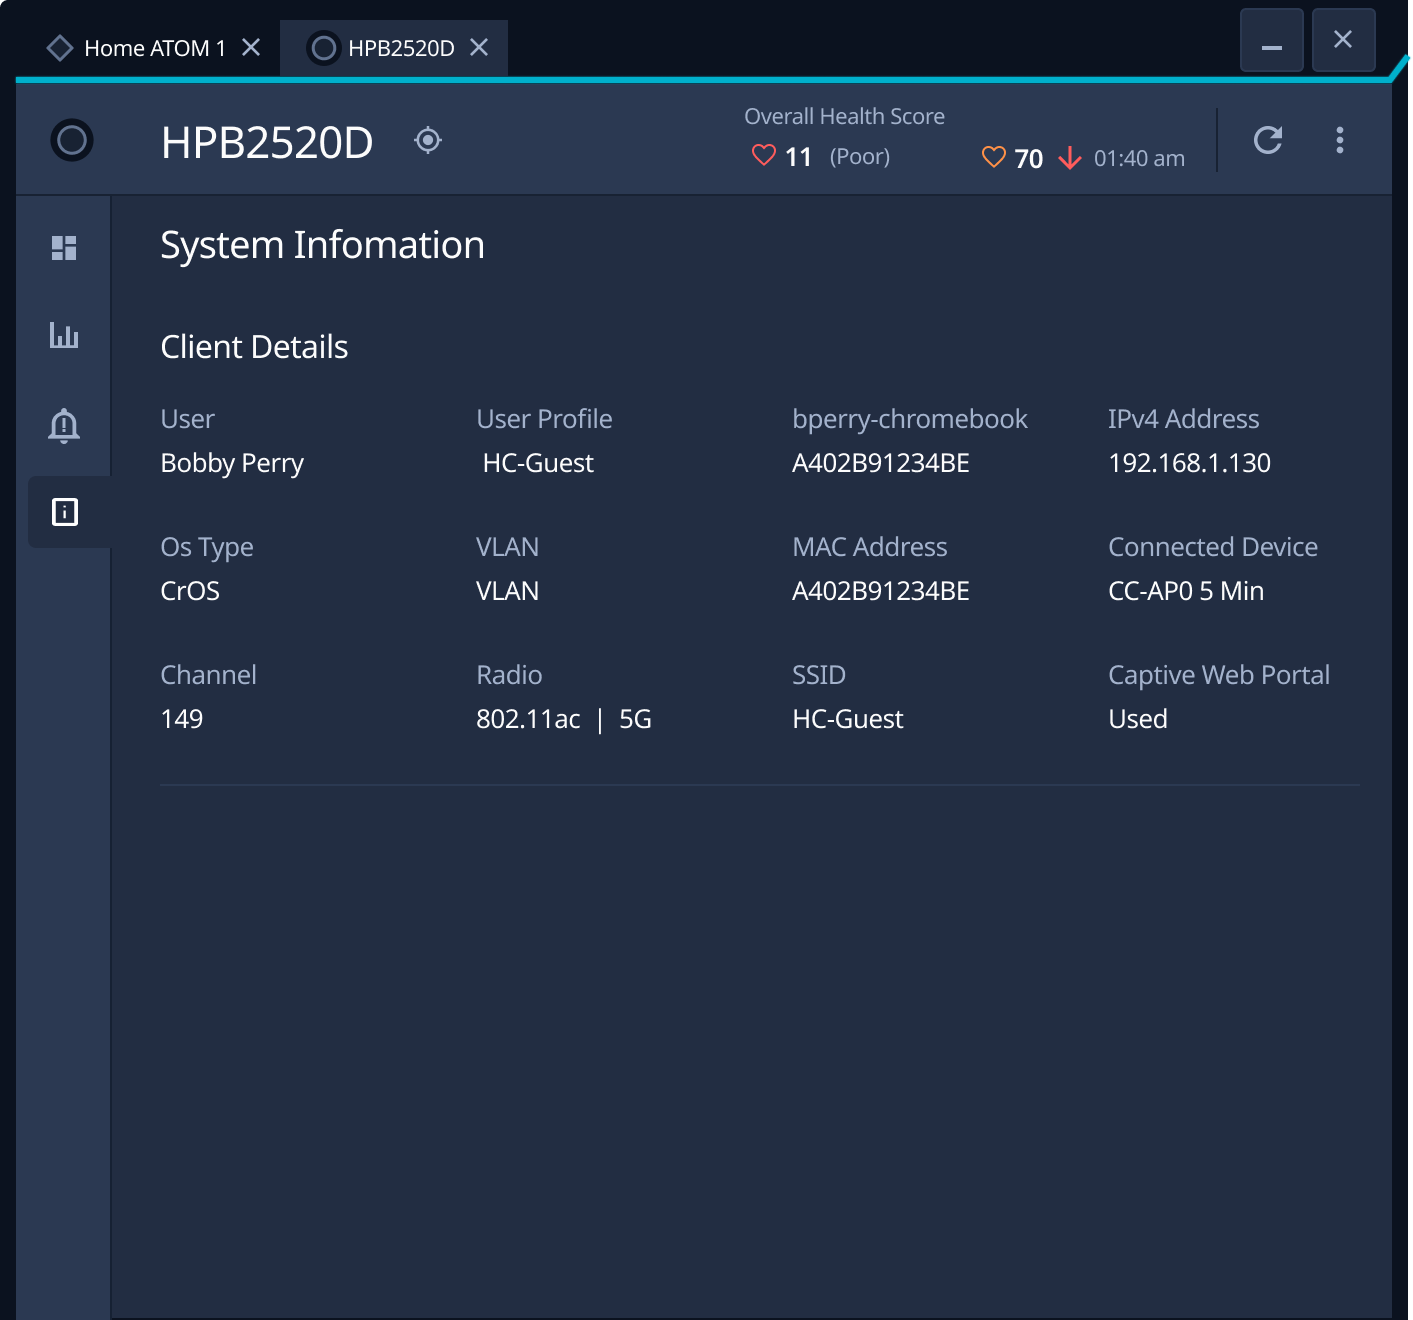
Systems generated data. Humans performed integration. Every incident: operators manually correlated alarm IDs → device locations → performance metrics → customer impact across 5 disconnected tools. 10+ minutes, 18–23 context switches before diagnosis even began.
Star & Strauss (1999): "Work that keeps things running but never shows up in system dashboards." That coordination labor? Never measured. Never improved.
NOC work isn't linear. New alerts fire. Shifts change. L1 escalates to L2. Every interruption destroyed context. L2 spent 5–10 minutes rebuilding mental models. That information existed nowhere except L1's head and scattered across 5 tool histories.
Miller (1956): Working memory holds 7±2 items. Operators juggled 20+ disconnected data points. Systems preserved data. They didn't preserve understanding.
Systems alerted AFTER thresholds breached. Never before. 0% early detection. By the time alerts fired, customers were already affected. Every incident became a crisis because systems provided no temporal visibility into emerging patterns.
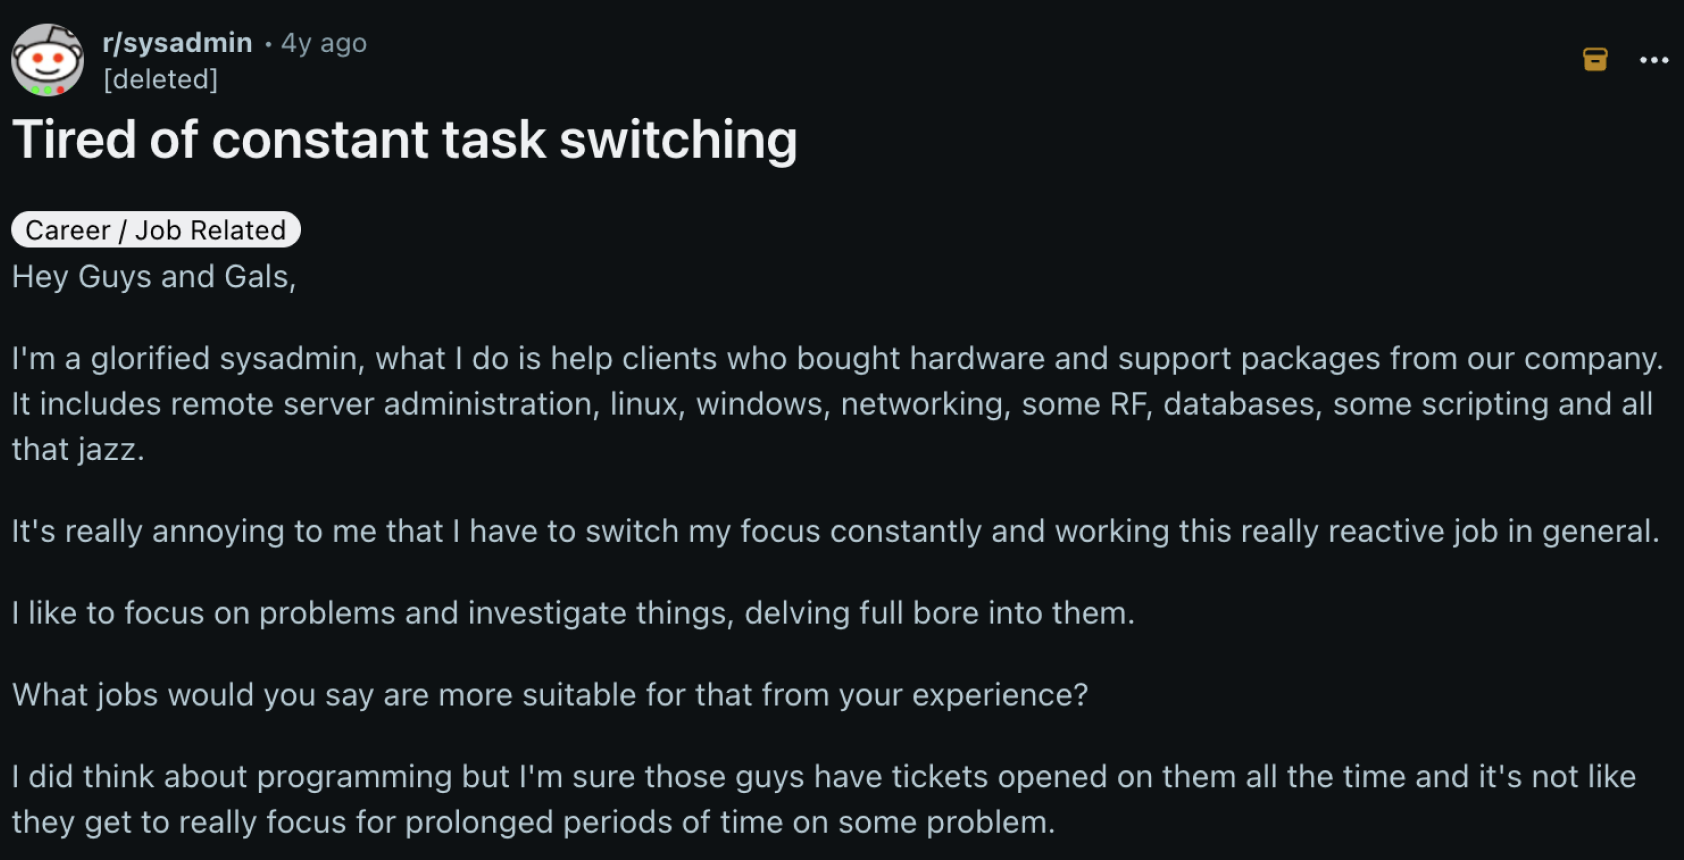
"Everything is on fire and needs fixing 20 minutes ago." , Reddit operator, r/sysadmin
Seniors: 5–7 metrics checked, 100% accuracy. Juniors: 25+ metrics checked, 37% accuracy. Juniors weren't checking too few , they were checking too many. Systems showed everything, prioritized nothing.
Chi, Feltovich & Glaser (1981): Experts use pattern recognition and selective attention. Novices search exhaustively. Not a training problem. A system design problem.
 r/sysadmin
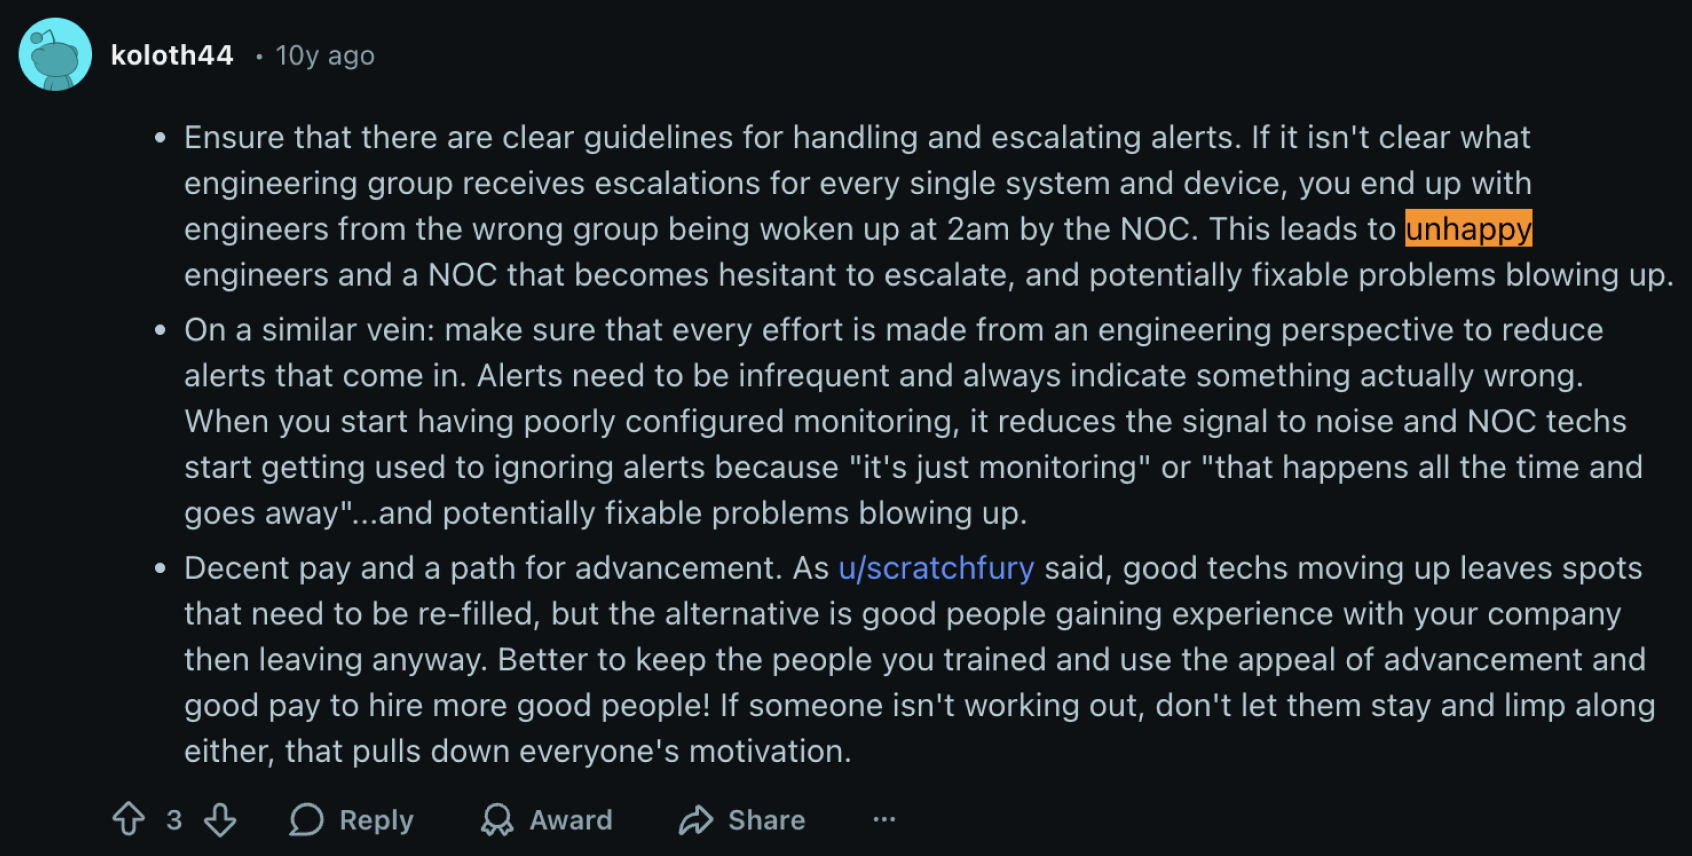 koloth44
 jmnugent
Operators became the integration layer, switching between 5 disconnected tools 18–23 times per incident. Context destroyed with every switch. Every escalation meant rebuilding understanding from scratch.
HMW preserve context across tools, interruptions, and escalations?
No shared data model or correlation engine. Operators manually mapped relationships with notepads, spreadsheets, and memory. 40–50% of operator capacity spent on integration labor that never appeared in metrics.
HMW make the system perform the correlation operators did manually?
Threshold-based alerting reacts after breach , no pattern recognition, no temporal analysis of degradation trends. 0% proactive detection. Preventable outages reached customers first.
HMW enable operators to prevent failures, not just respond?
Same overwhelming interface for novices and experts. Juniors checked 25+ metrics with 37% accuracy. Seniors checked 5–7 with 100% accuracy , manually filtering noise the system should hide.
HMW match system intelligence to operator expertise?
System surfaces relationships operators currently discover manually. Correlation becomes a system capability, not human burden.
Temporal visibility into emerging patterns enables prevention. Operators act before thresholds breach, not after.
System support matches operator expertise. Juniors get structured guidance. Seniors get noise filtered out.
Mental models must survive interruptions, tool switches, and escalations. Spatial layout preserves what working memory can't hold.
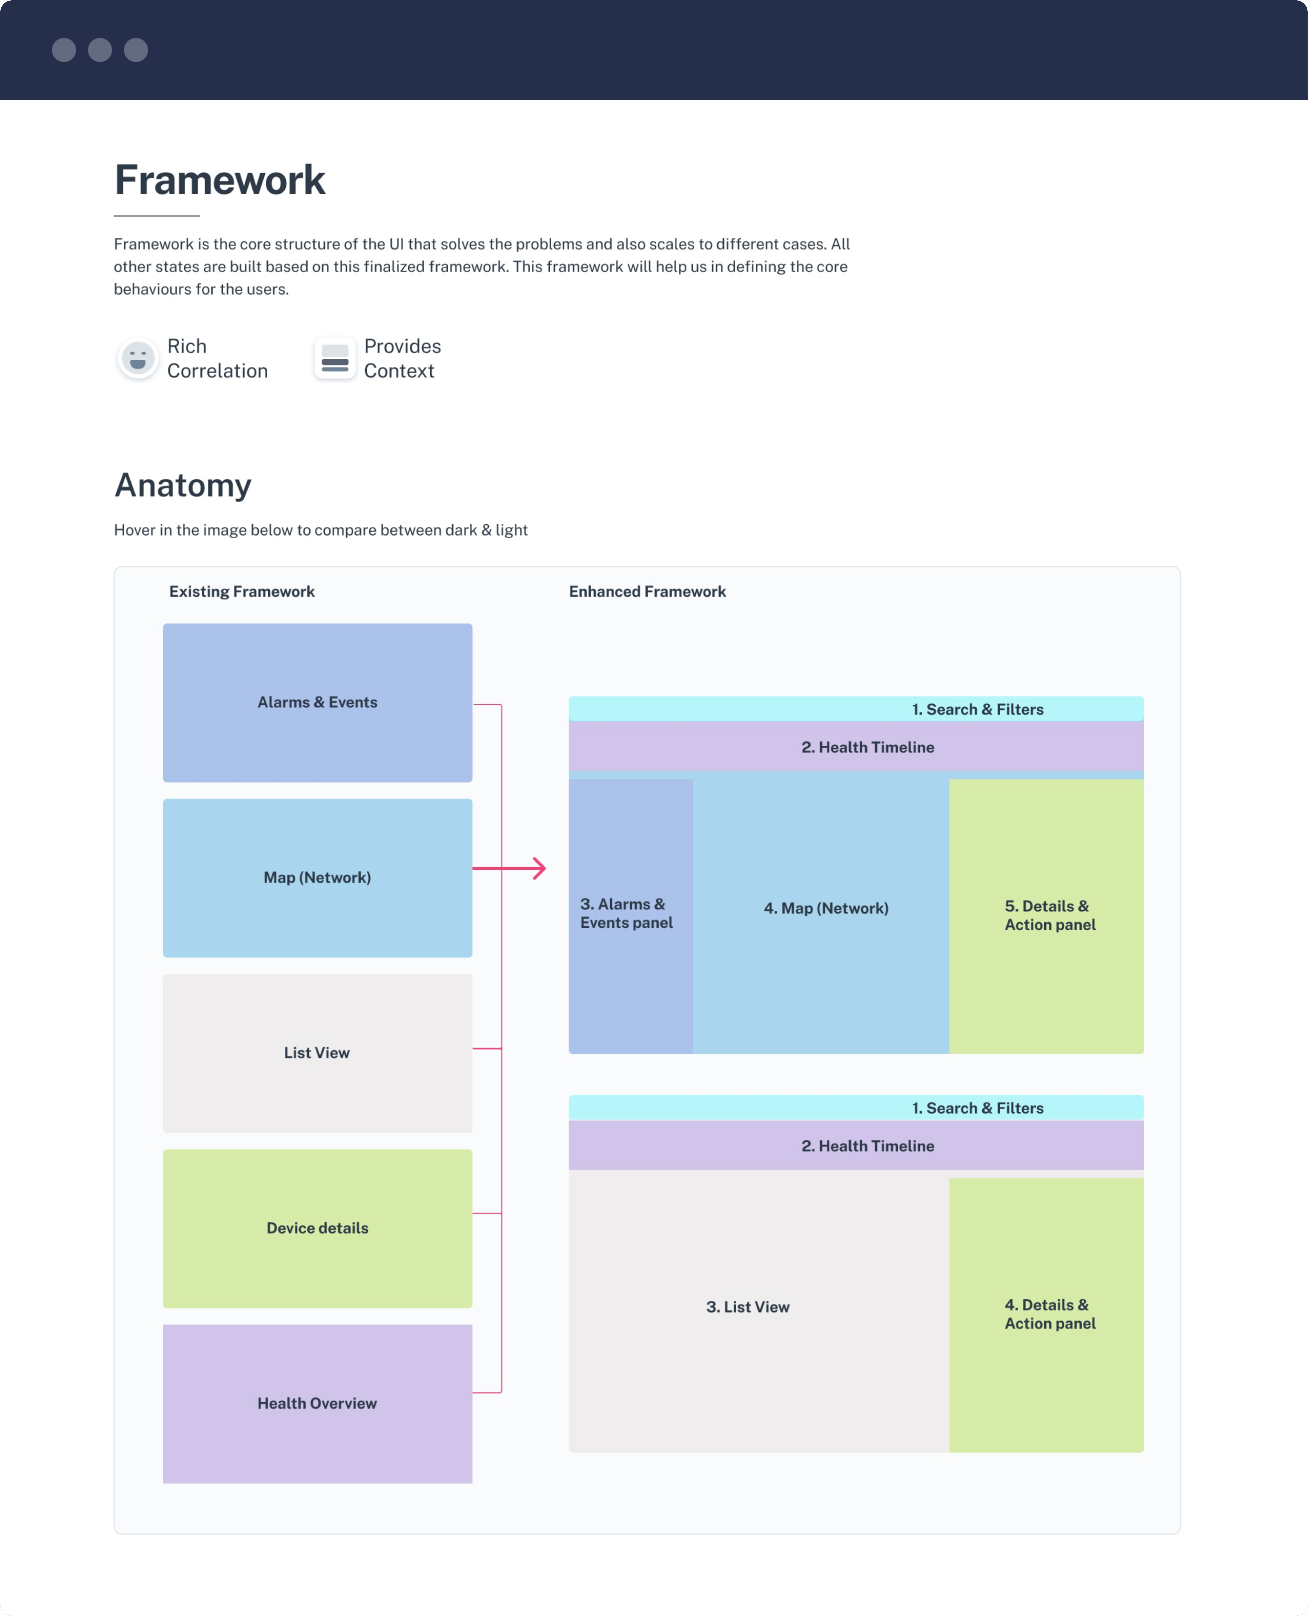
Four problems identified. Four different solutions needed.
We didn't jump to wireframes. Surface-level consolidation , "one workspace" , wouldn't address invisible work, reactive architecture, or expertise mismatch. We needed a framework that solved each problem deliberately.
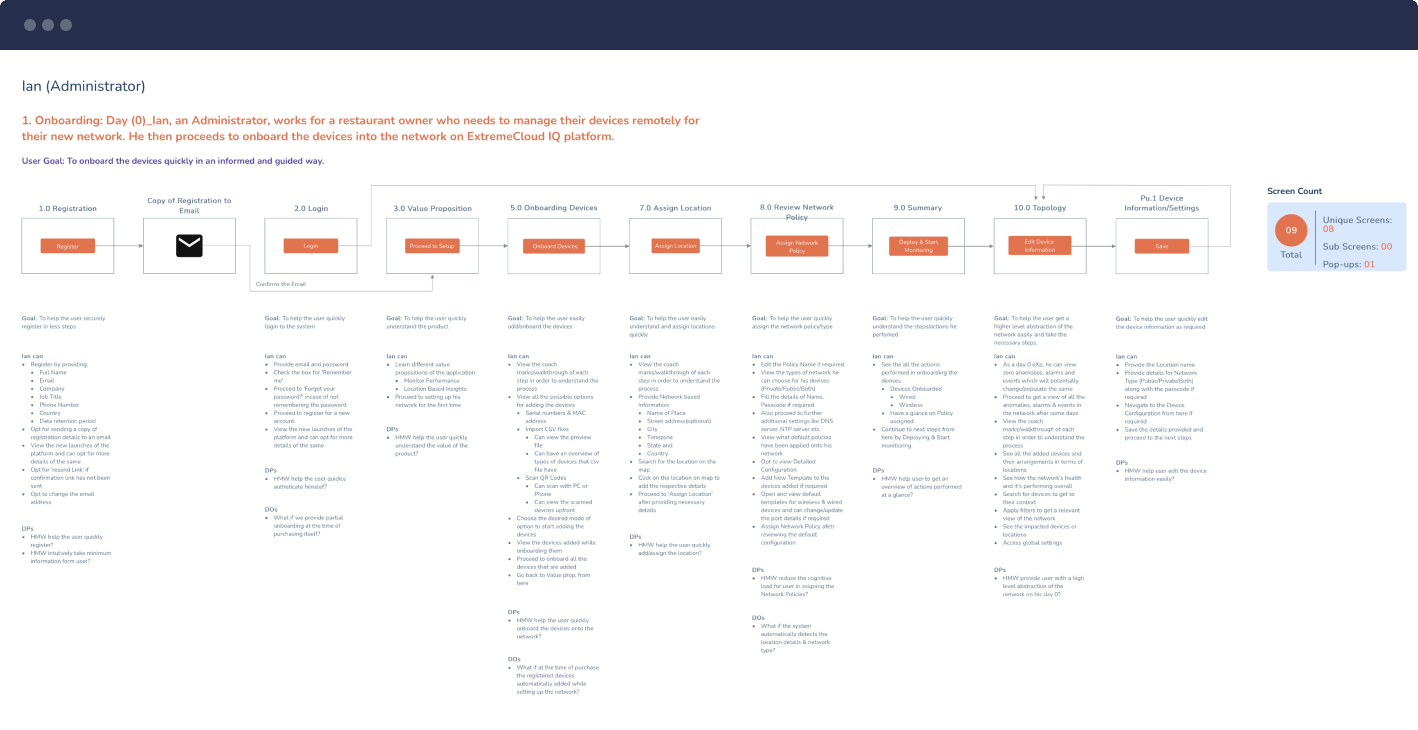
First, we mapped ideal workflows for each operator tier (L1, L2, L3). Not what they currently did, but what they SHOULD be able to do if systems supported them properly. What would diagnosis look like if context never died? If correlation happened automatically? If operators could prevent instead of react?
These ideal-state workflows revealed four design principles that became our framework:
Fitts's Law Violation
Distance = Time = Cognitive Cost
5 separate tools created maximum distance between related data. Every tool switch added physical distance (mouse travel), temporal distance (window switching), and cognitive distance (mental model rebuilding).
Automated Correlation
System automatically correlates data that operators previously connected manually. Cognitive burden shifts from human memory to system capability. Operators are freed from integration labor to focus on diagnosis.
Gestalt Principle
Proximity Creates Relationship
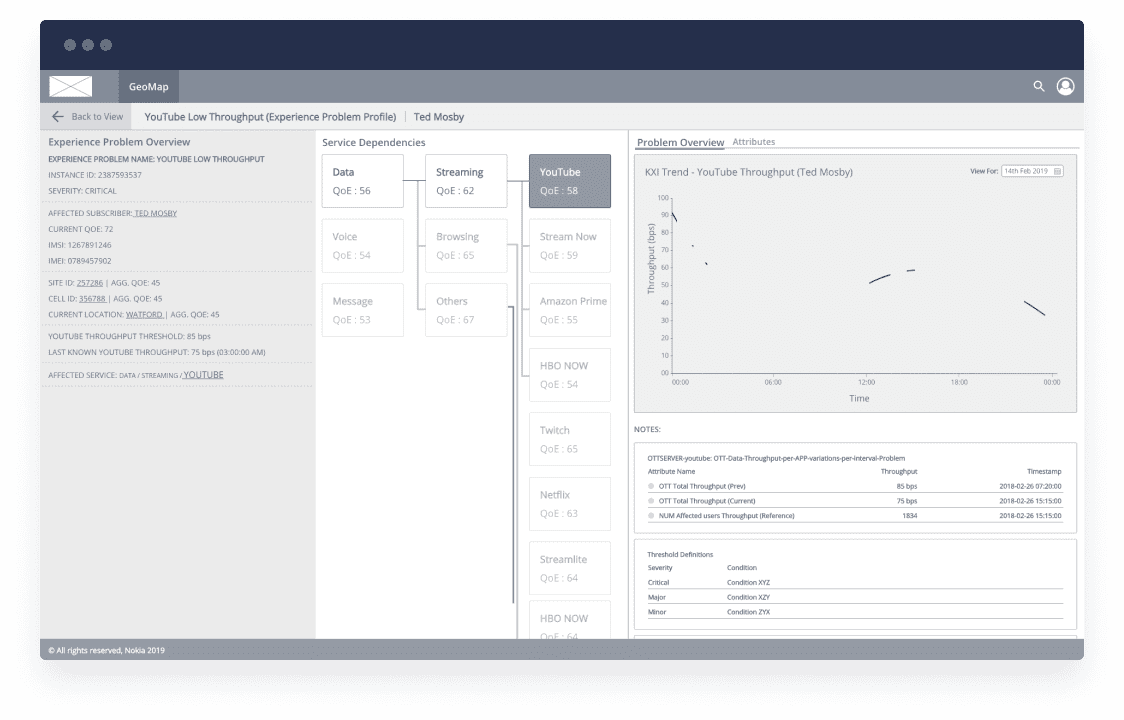
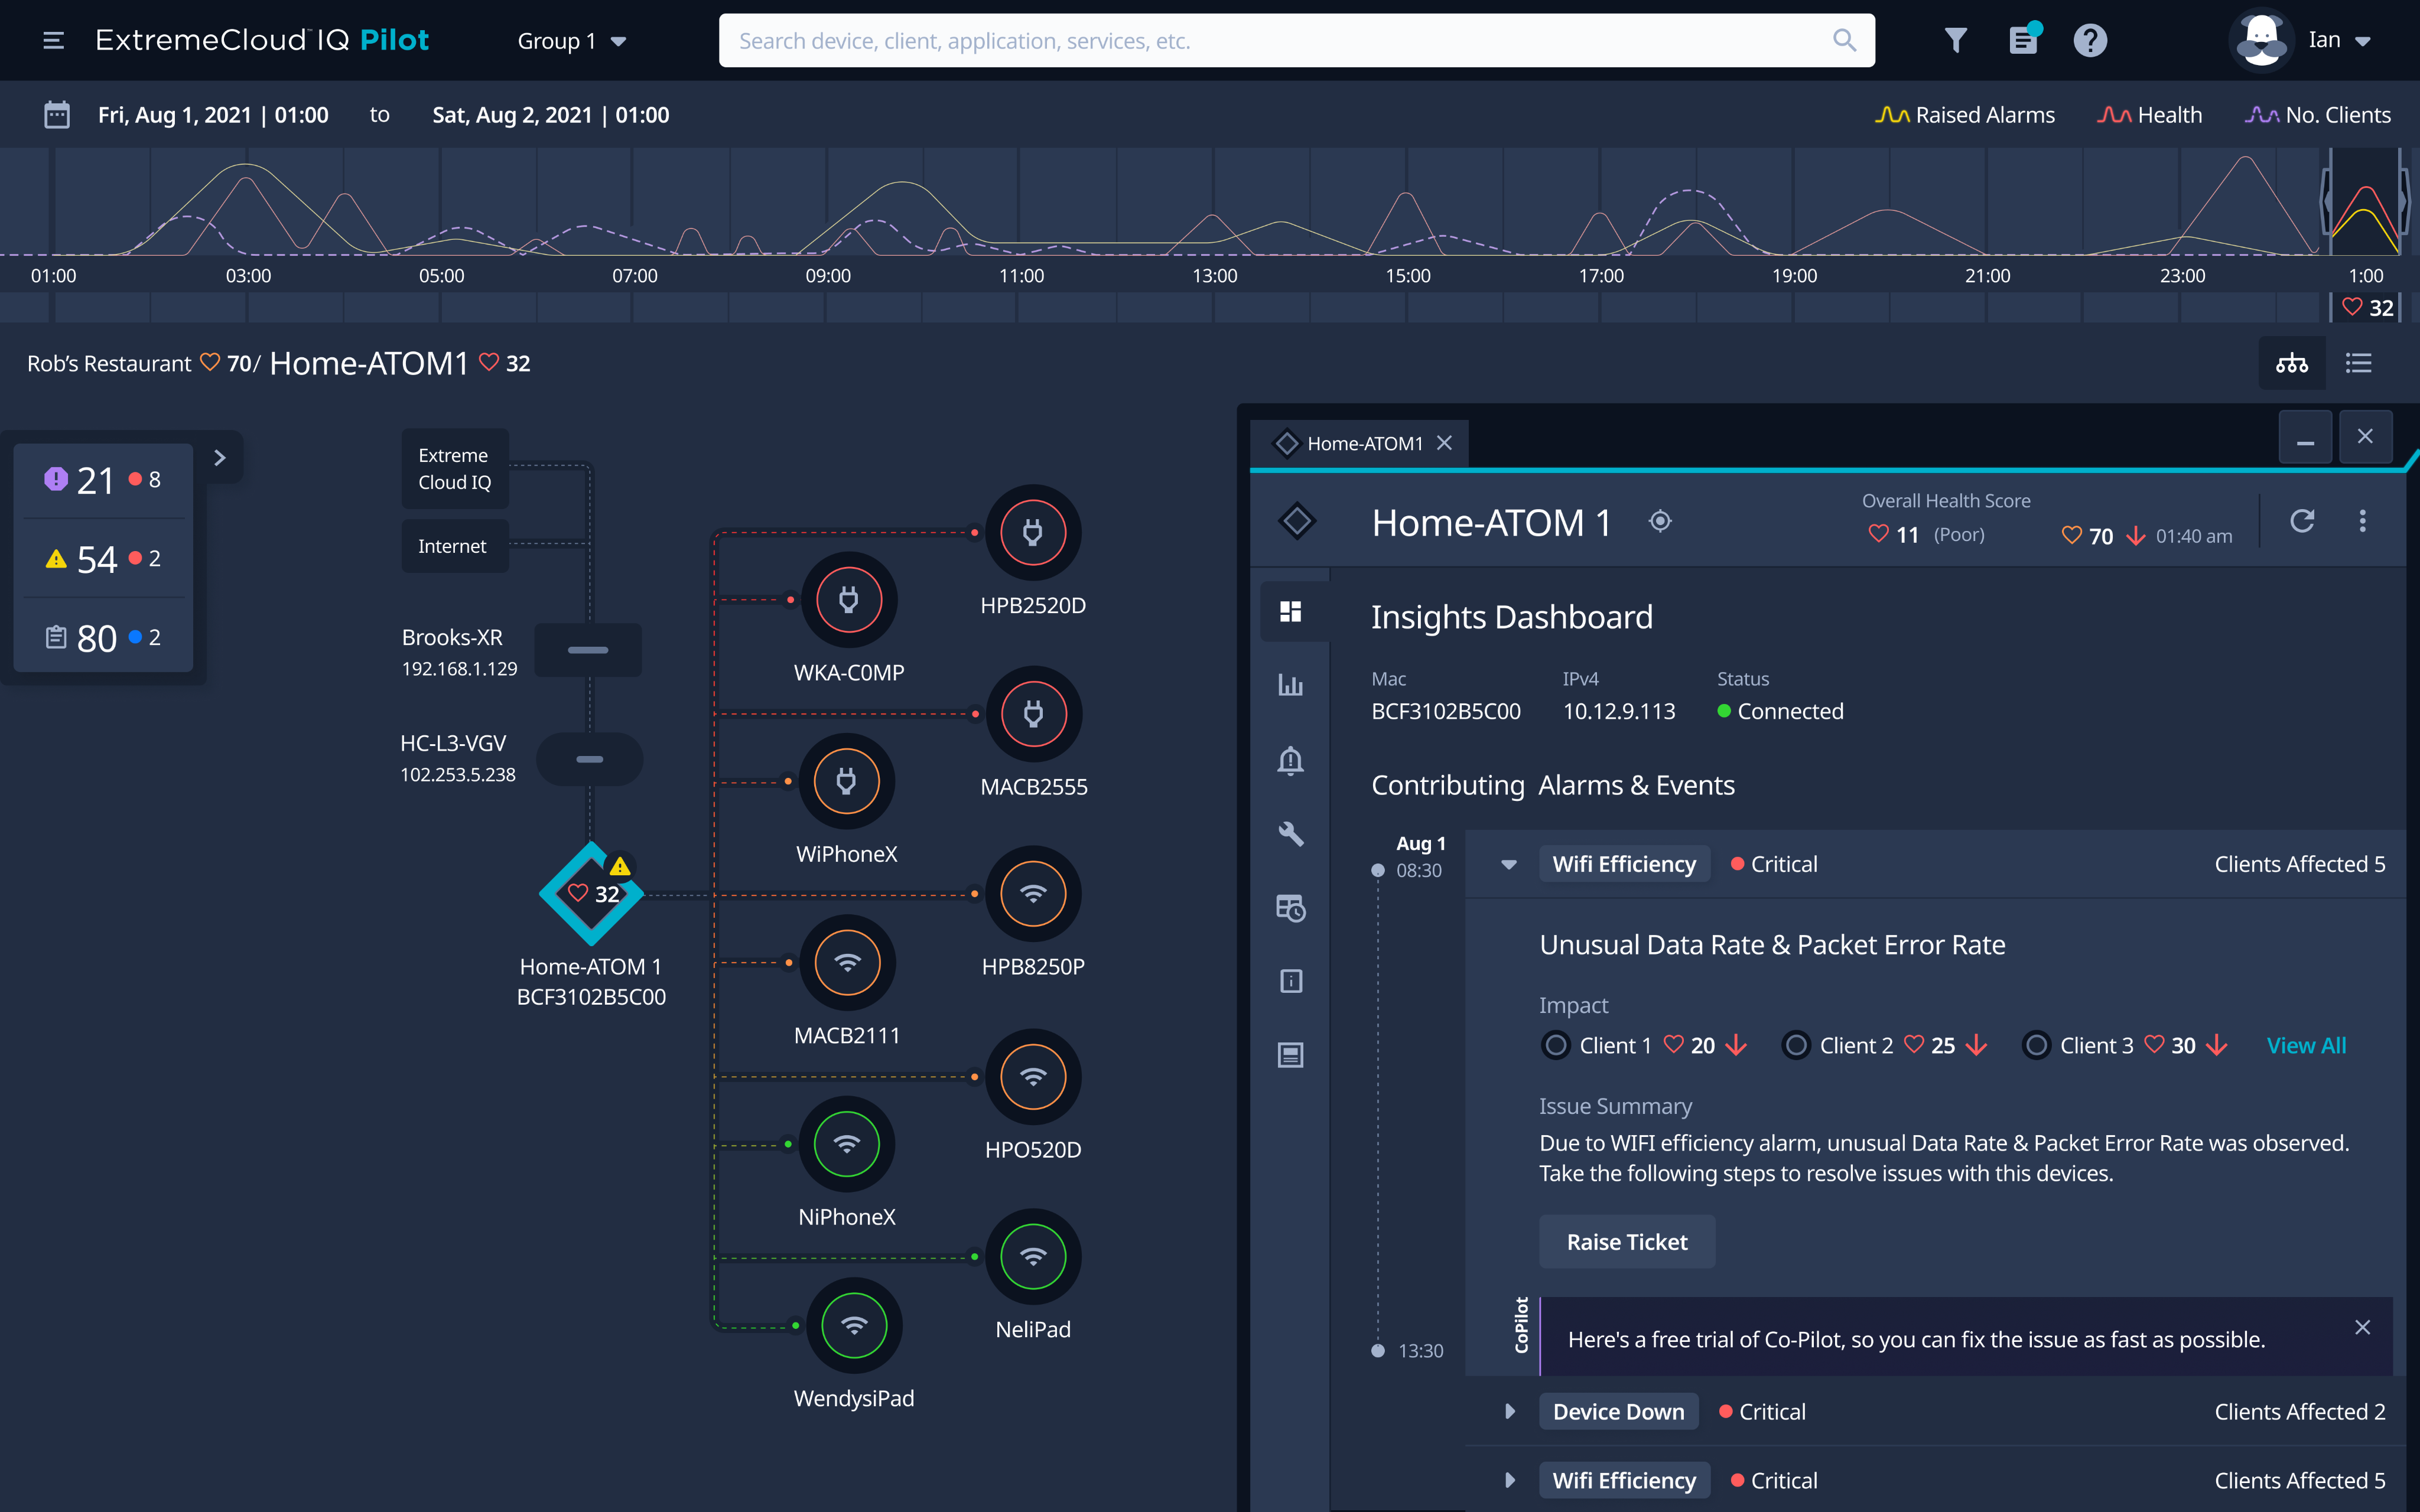
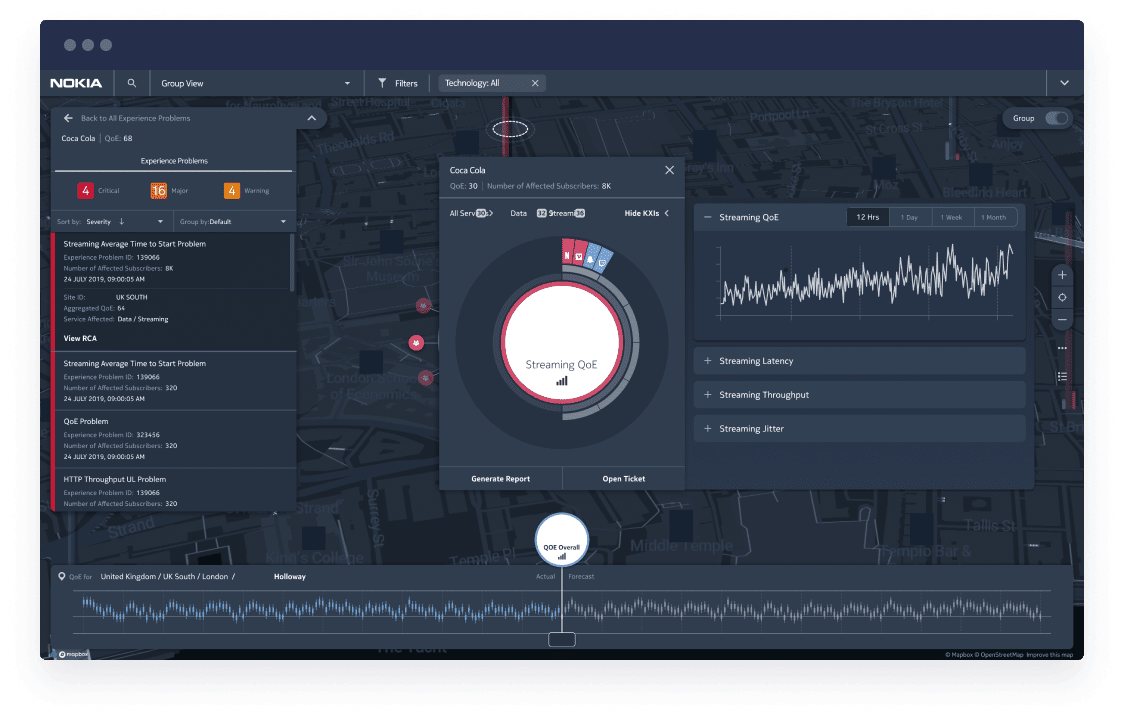
Unified workspace places related data in visual proximity. Alarm ID, affected devices, and customer impact appear together. Operators see connections through spatial layout, not memory. Tool 1's alarm now visibly links to Tool 5's customer impact.
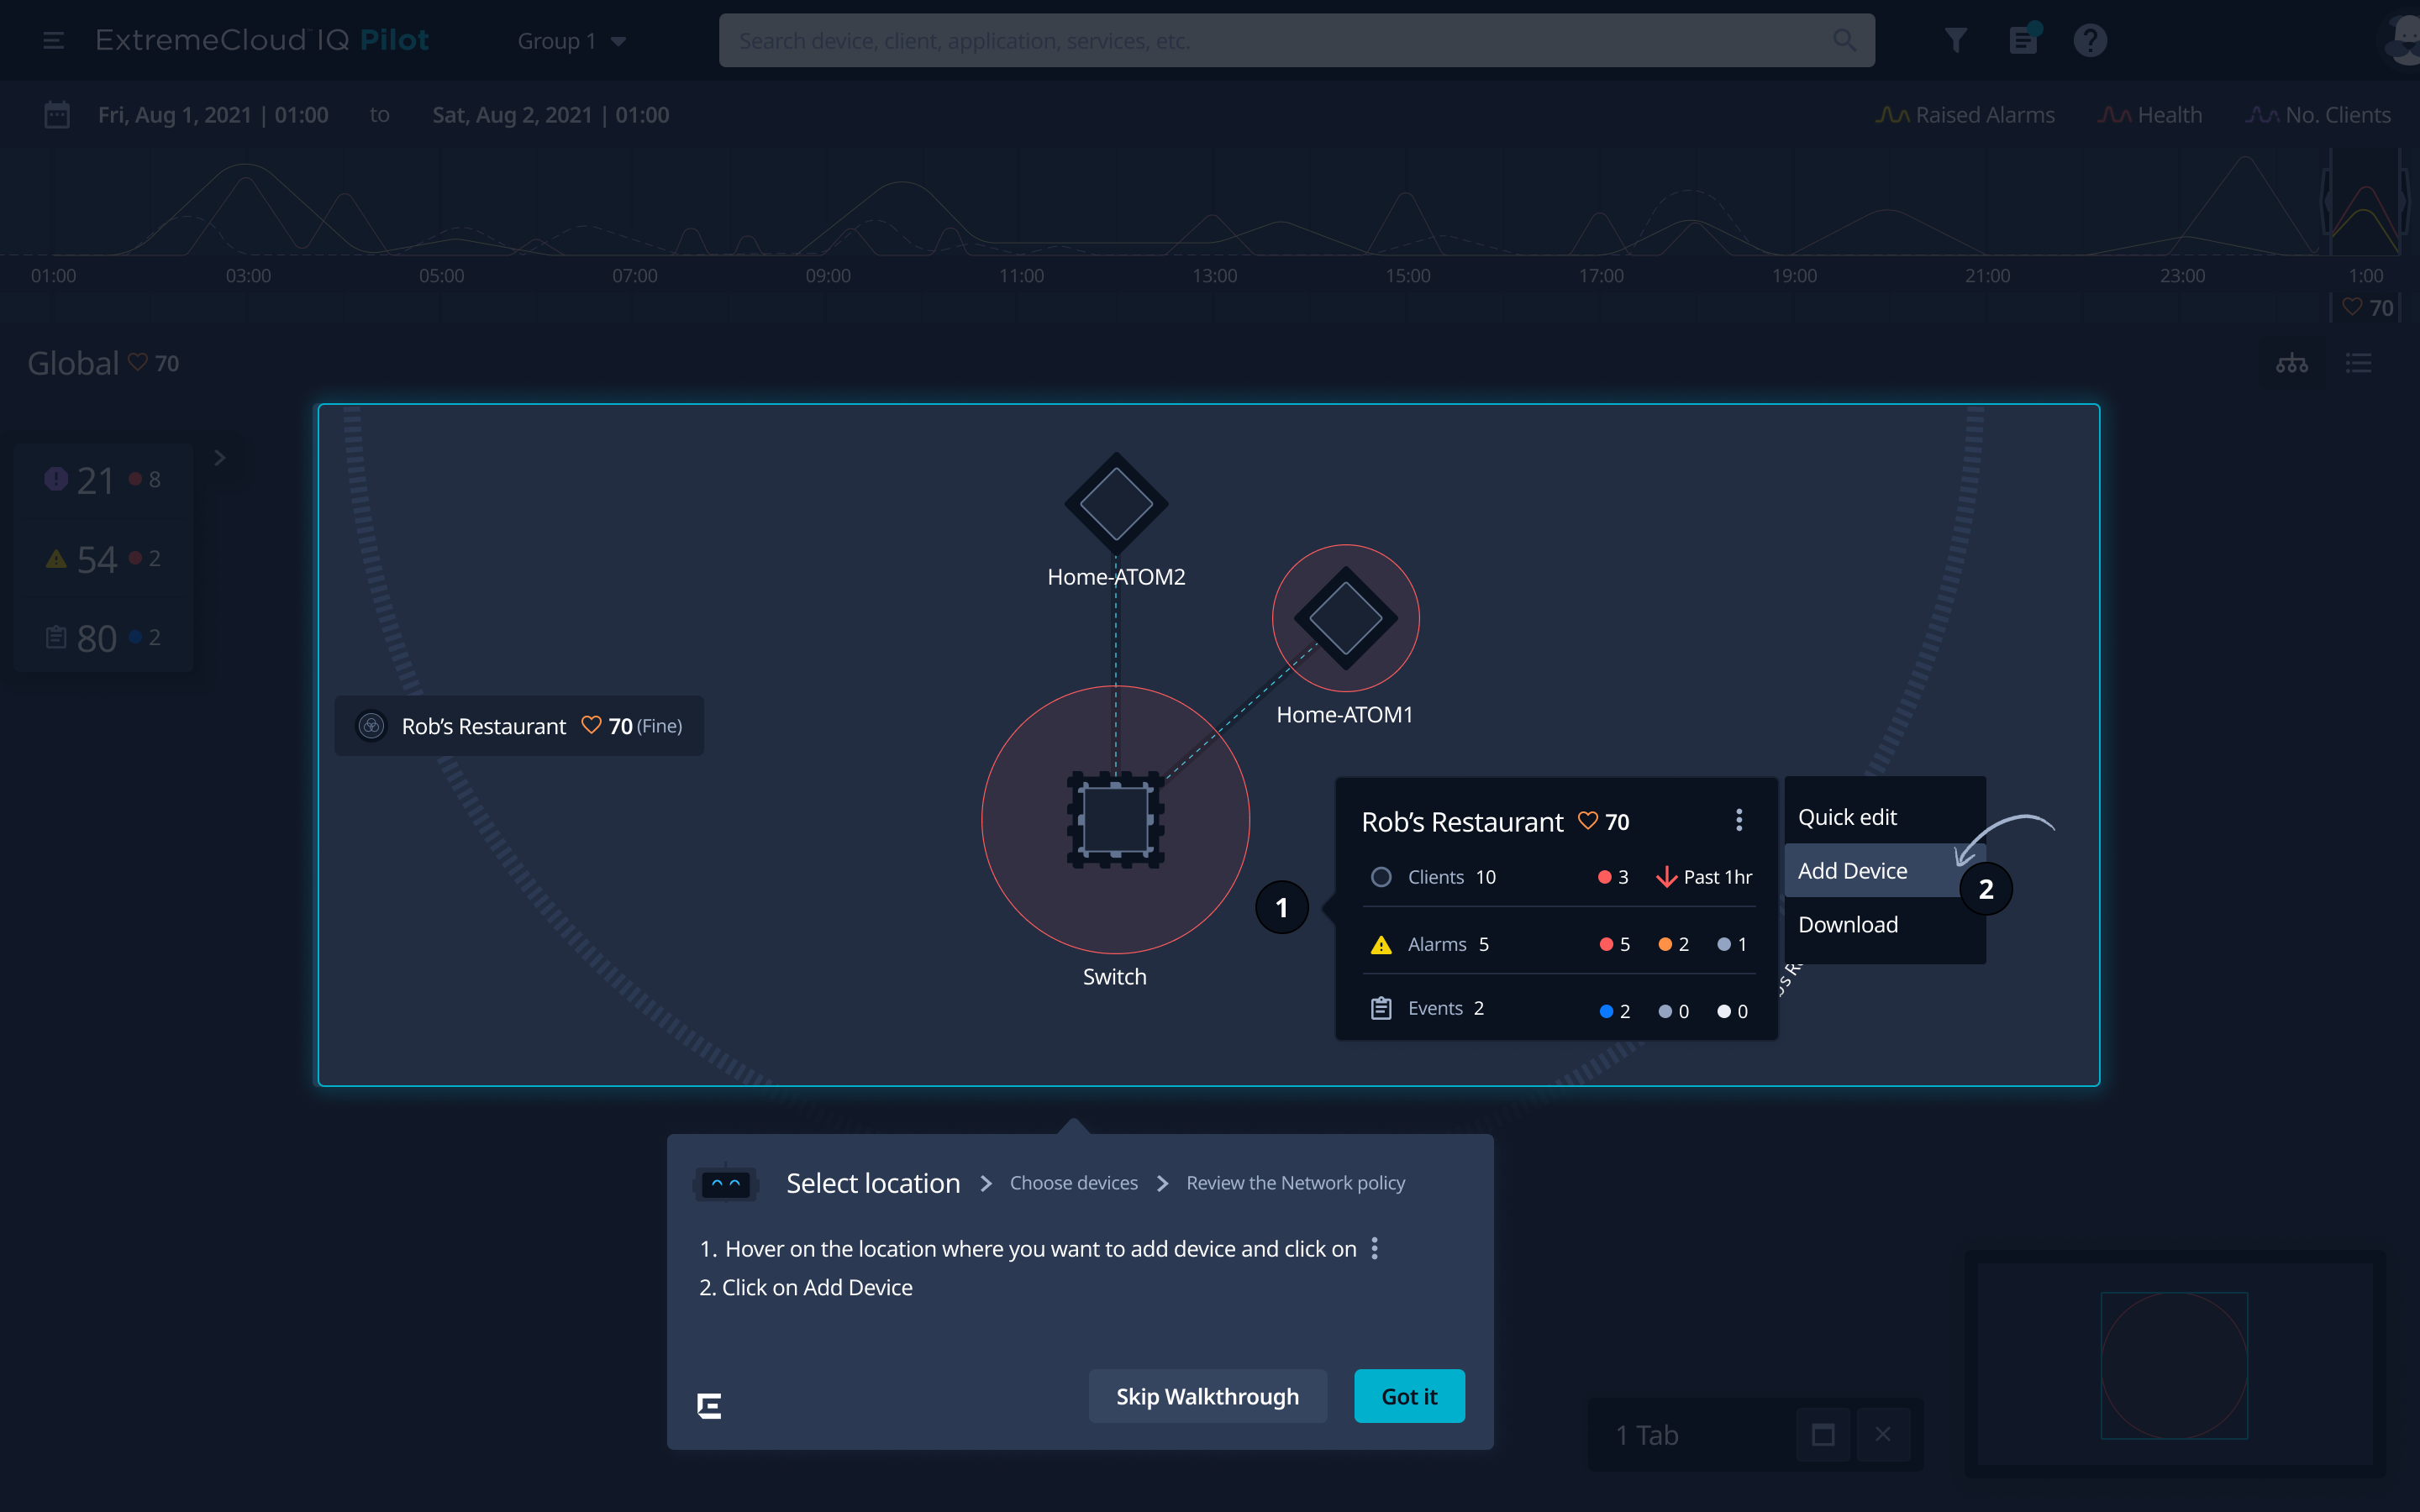
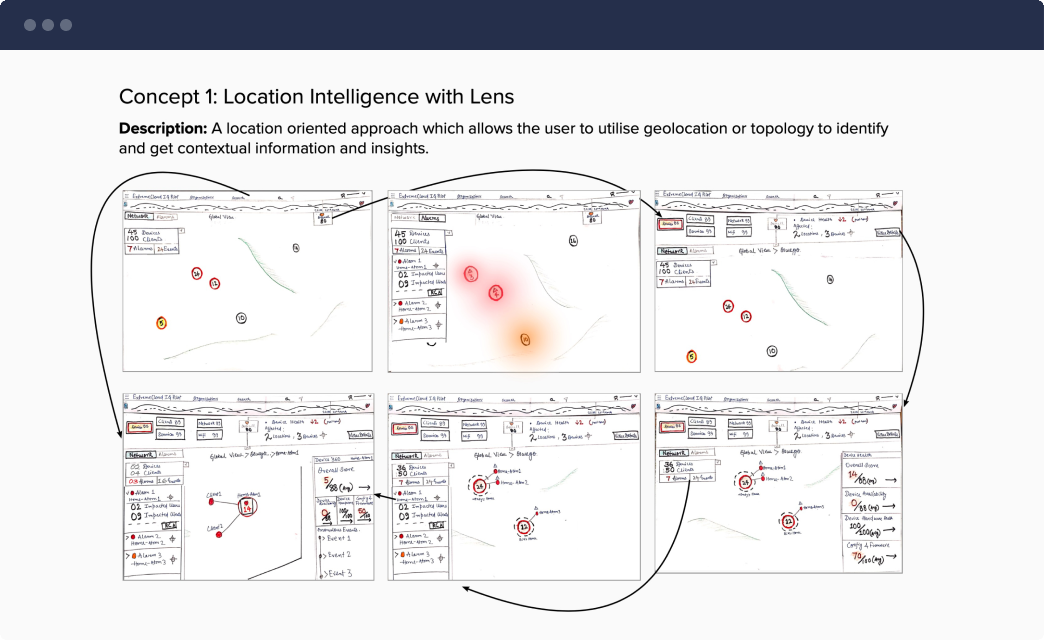
The Solution: Unified workspace with persistent spatial layout. Timeline left, correlation center, customer impact right. Operators navigate within workspace, not between tools.

Working Memory Overload
Miller (1956) showed humans max out at 7±2 items. Operators juggled 20+ across tools. Workspace externalizes what exceeded cognitive capacity.
Nielsen #6: Recognition Over Recall
Operators see relationships instead of remembering them between tools.
The Solution: Auto-linked correlation engine connects alarm IDs → affected devices → customer impact → performance metrics. System performs integration operators did with notepads.
Distributed Cognition
Hutchins (1995): Cognitive work distributed to system. Operators interpret integrated data instead of integrating scattered data.
Invisible Work Made Visible
Star & Strauss (1999): Coordination labor "invisible to rationalized models." System performs this automatically. 40–50% of capacity redirected to diagnosis.
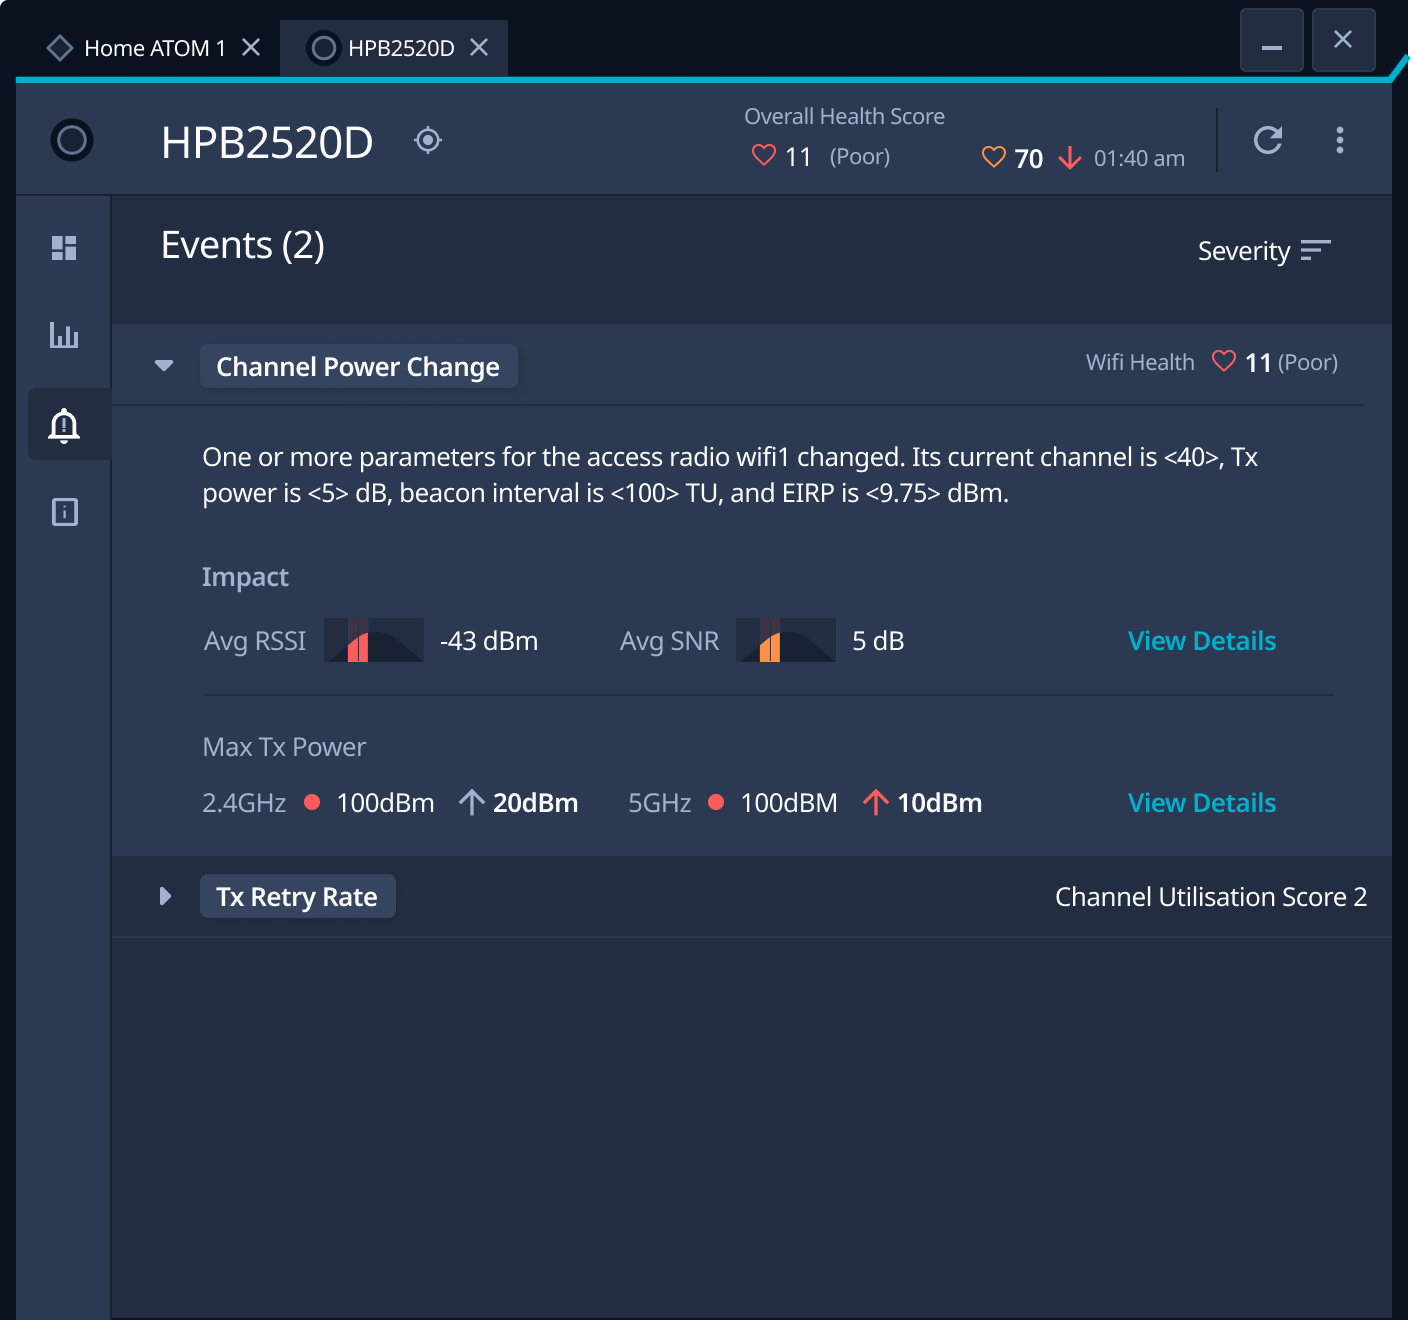
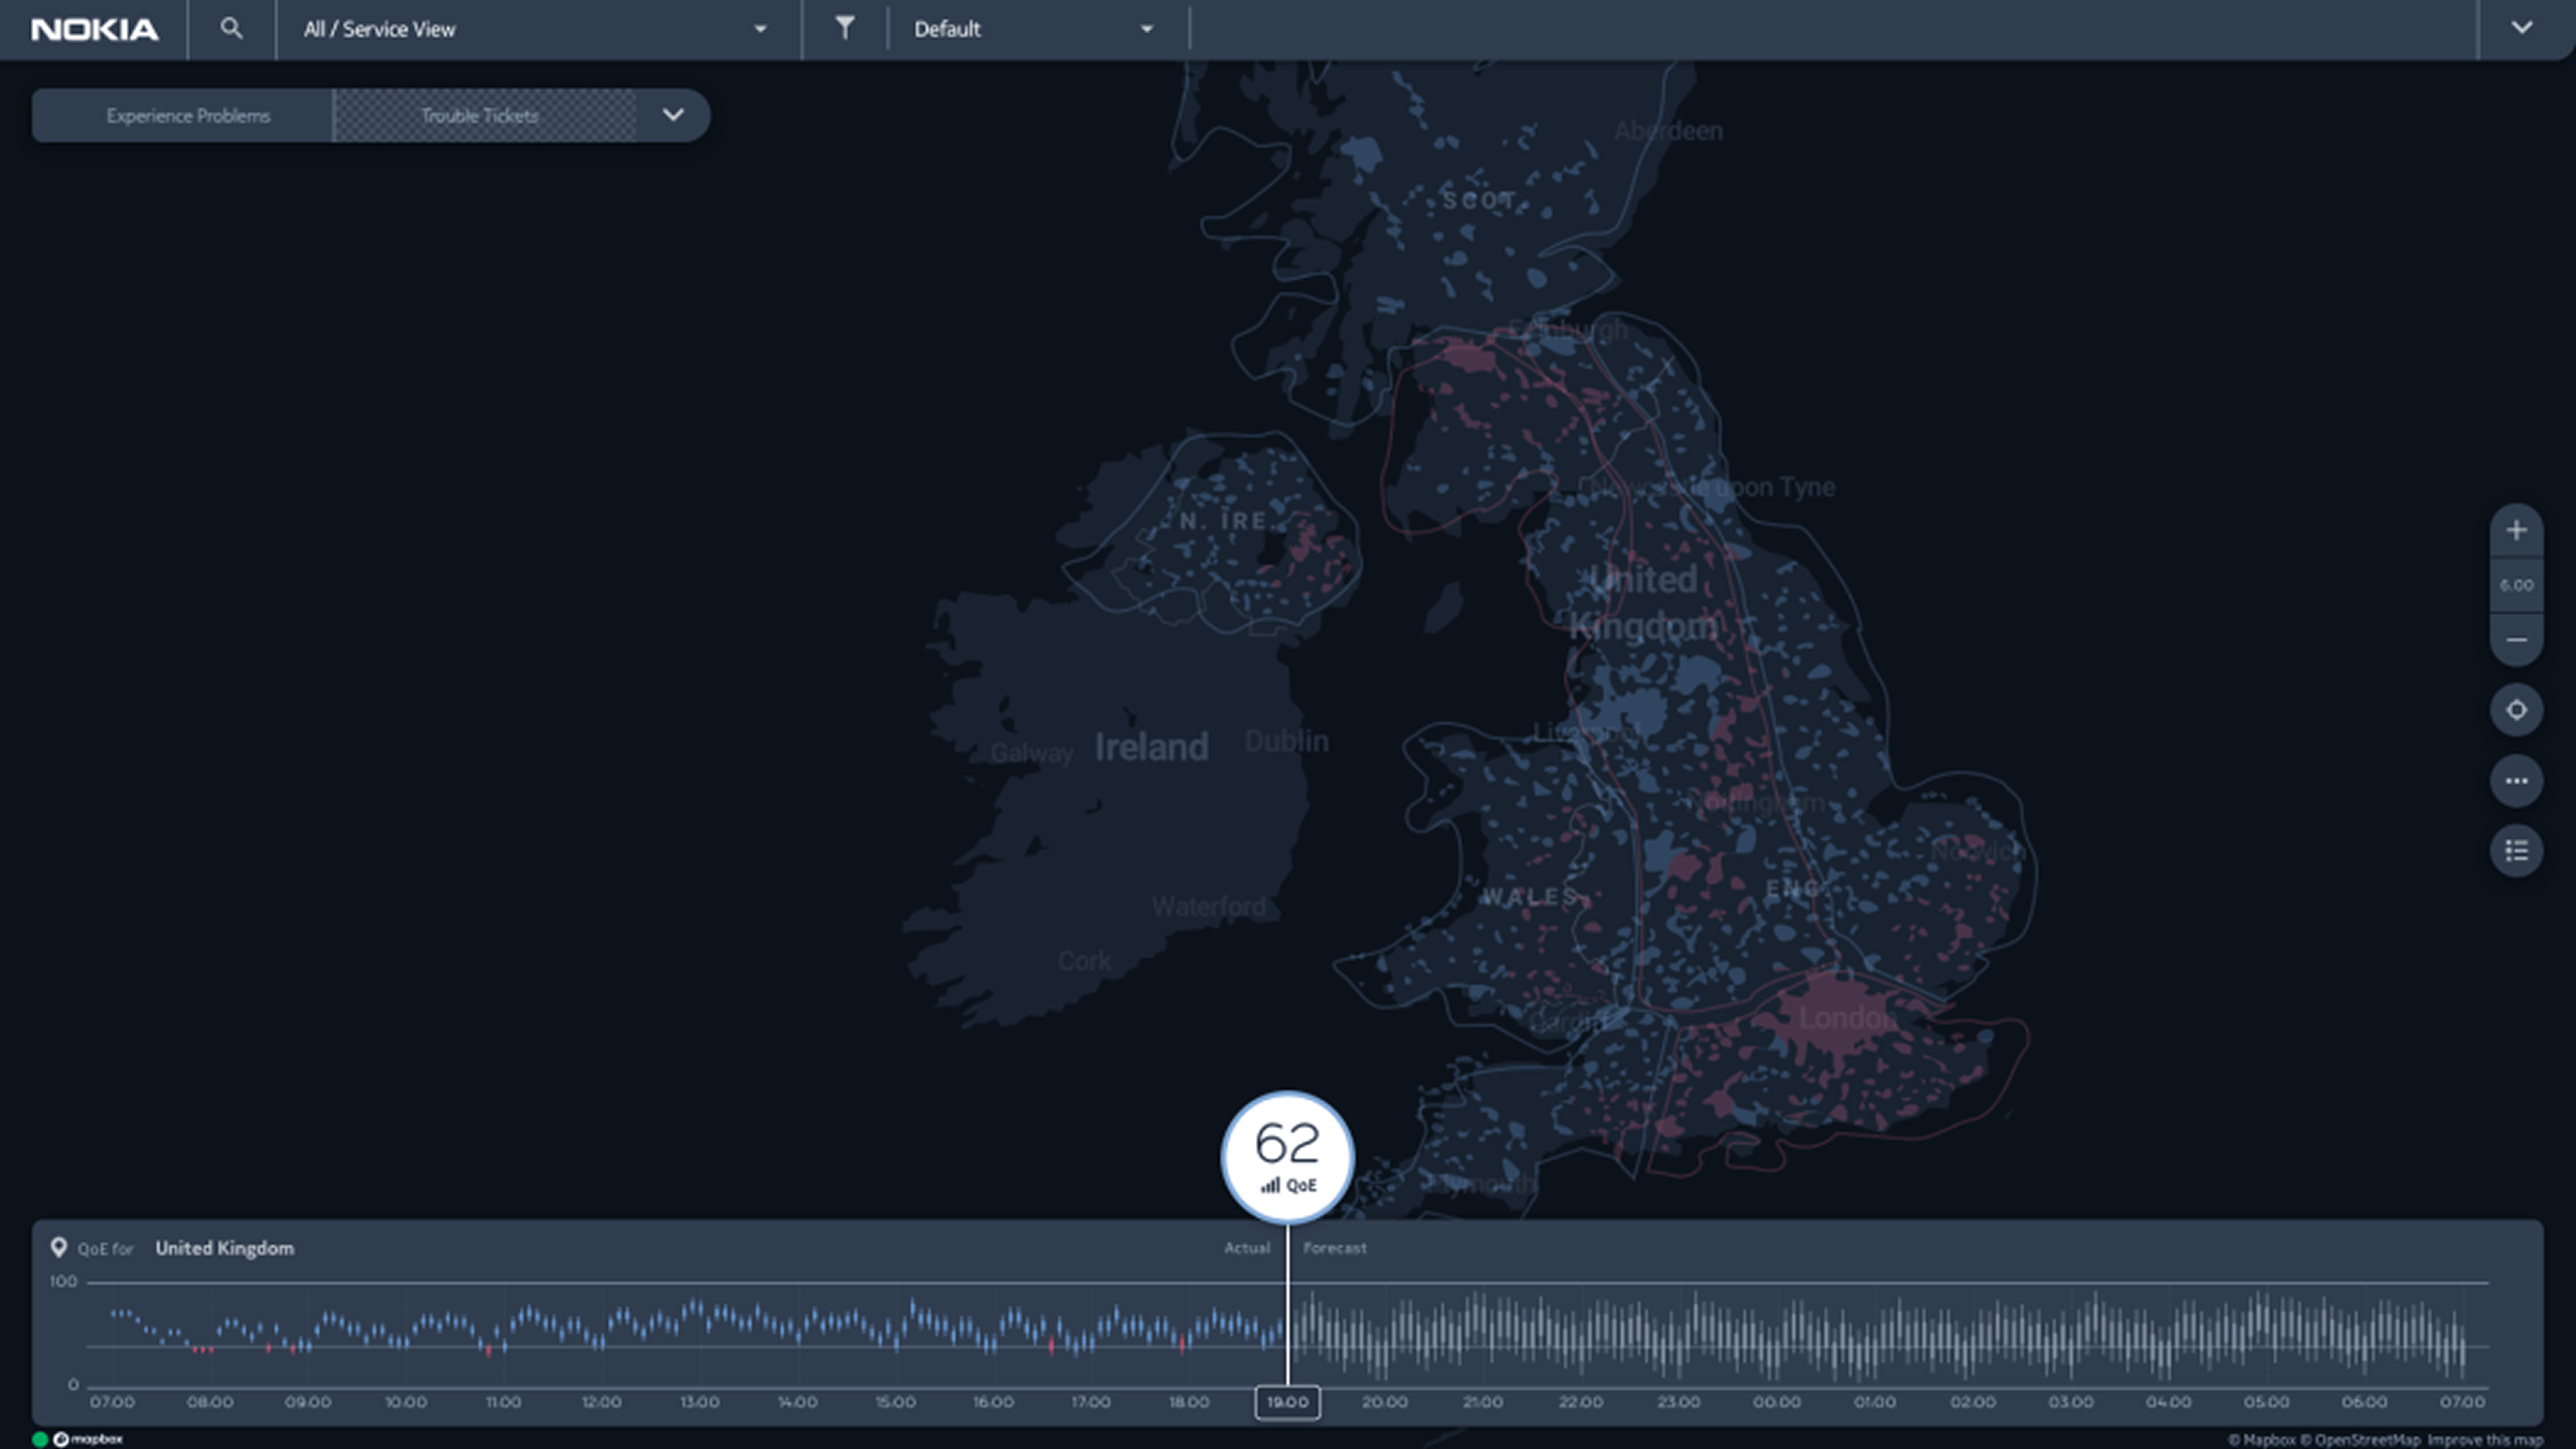
The Solution: Predictive timeline with 20–30 min advance warning. Statistical anomaly detection surfaces early degradation patterns before threshold breach.
Temporal Visibility
Suchman (1987): Can't prevent what you can't foresee. Predictive layer provides temporal visibility systems lacked.
Trust Through Transparency
Lee & See (2004): Confidence indicators prevent automation bias. Operators know when to trust predictions.
The Solution: Contextual guidance adapts to expertise. Juniors see highlighted metrics with "check this first" priority. Seniors see minimal interface with pre-filtered noise.
Scaffolding for Novices
Lave & Wenger (1991): Legitimate peripheral participation. Juniors need structured access to expert practice.
Expert Selective Attention
Chi et al. (1981): Experts use pattern recognition, filter noise. Pre-filtered interface respects expert chunking patterns (5–7 metrics, not 25+).

Four solutions working as a unified system.
Context preserved, correlation automated, failures predicted, expertise supported.
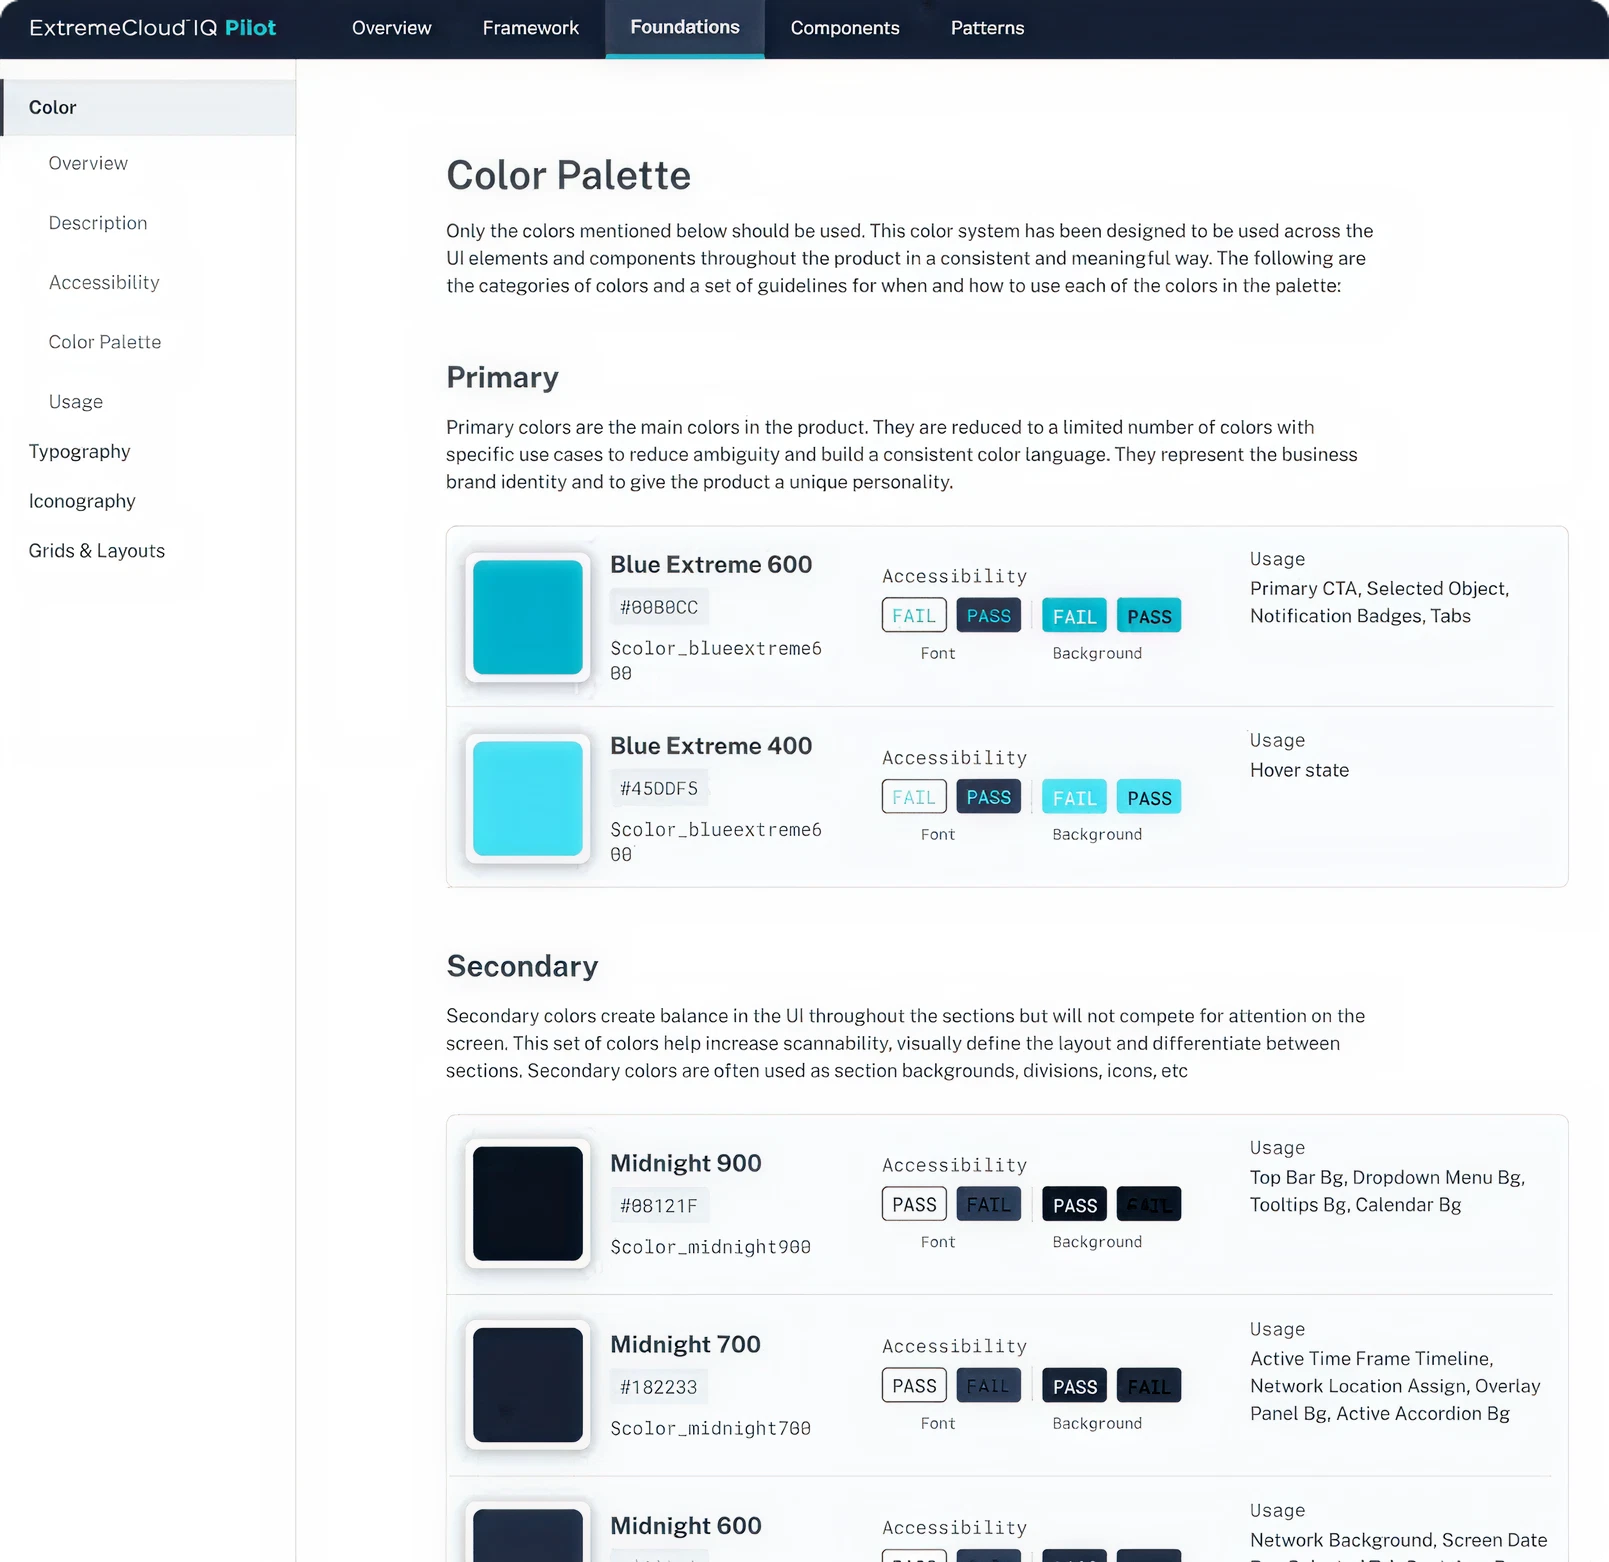
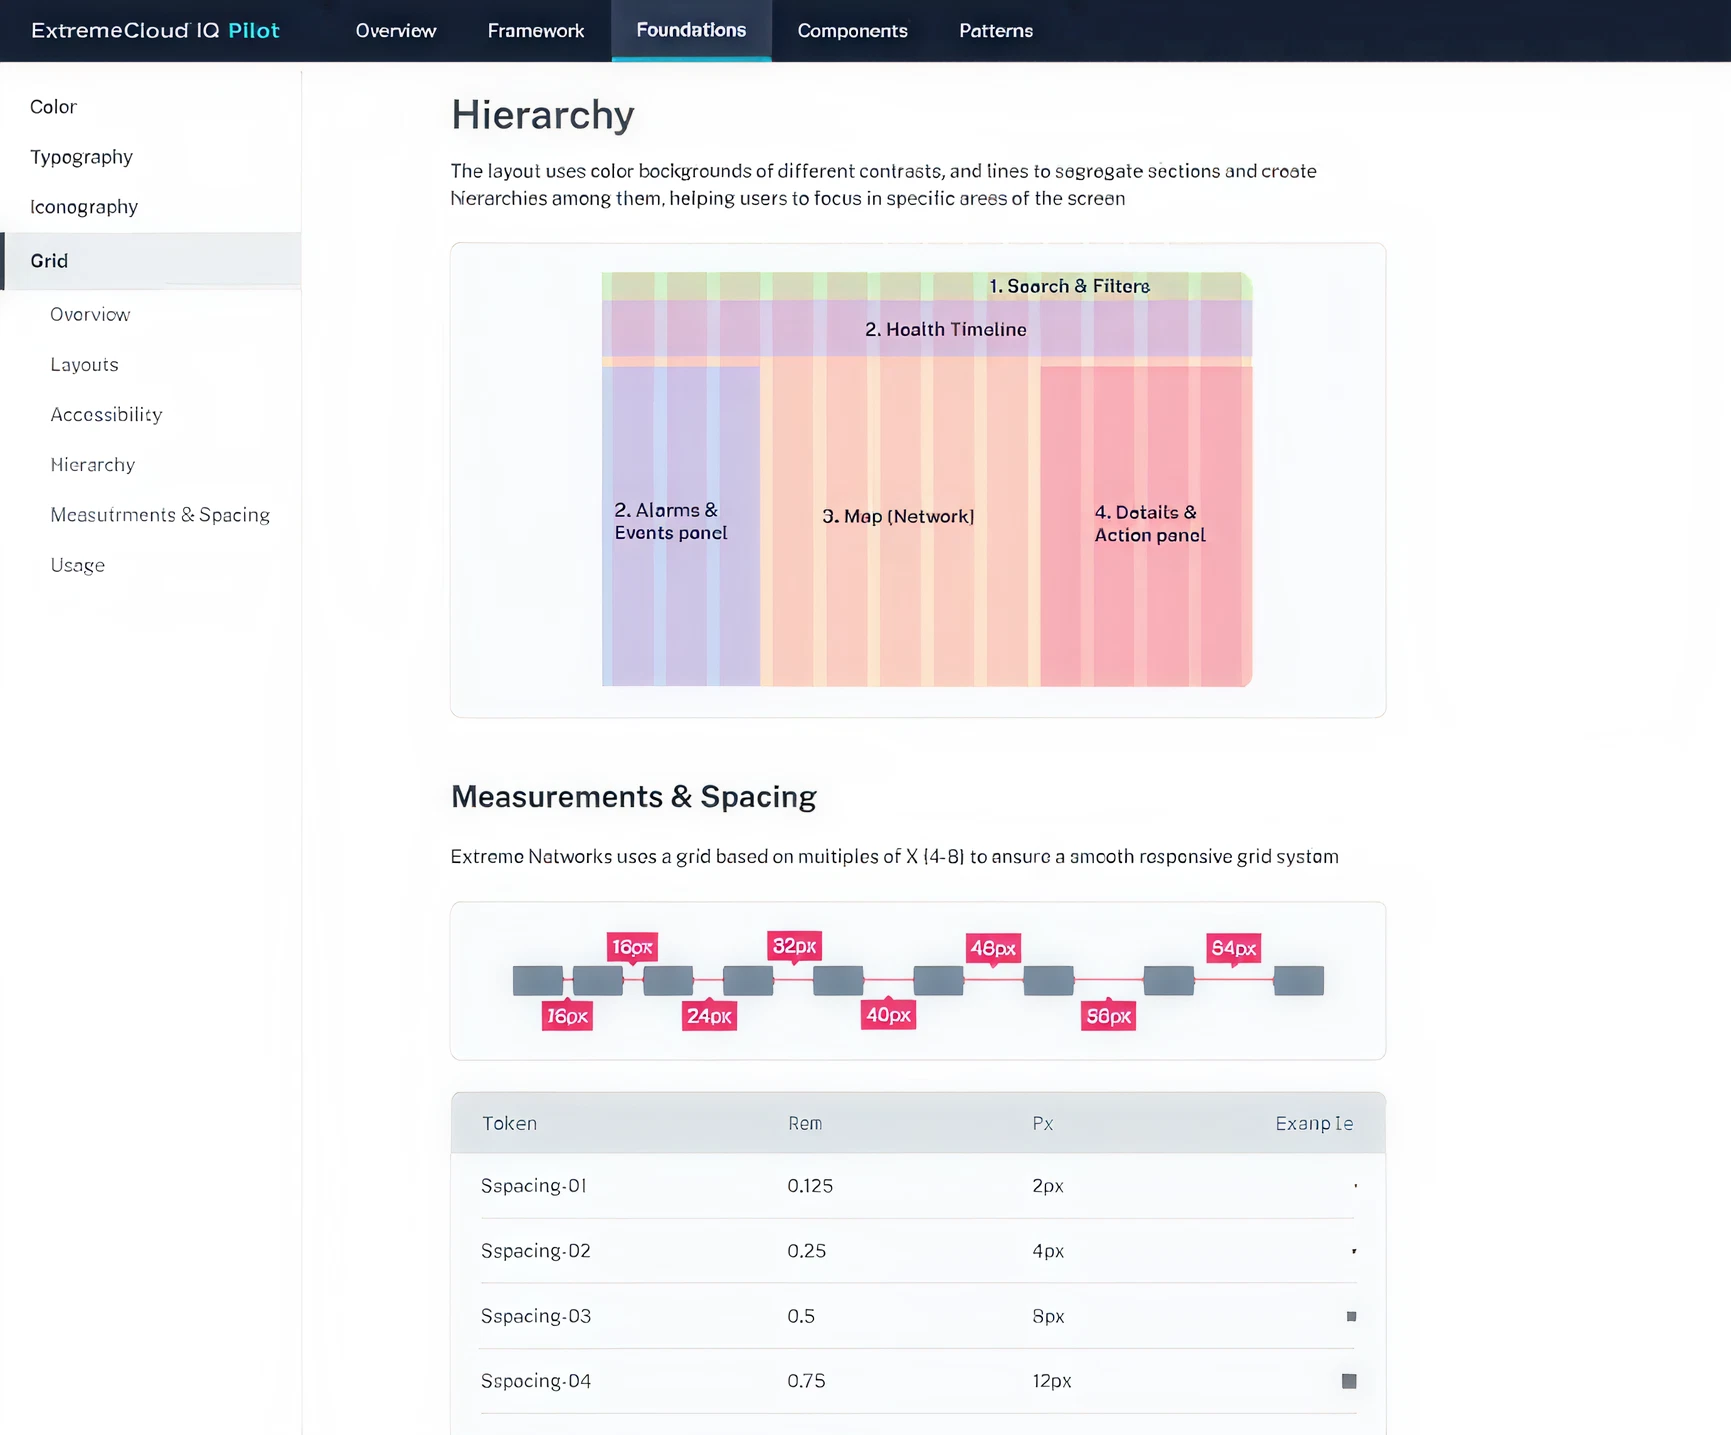
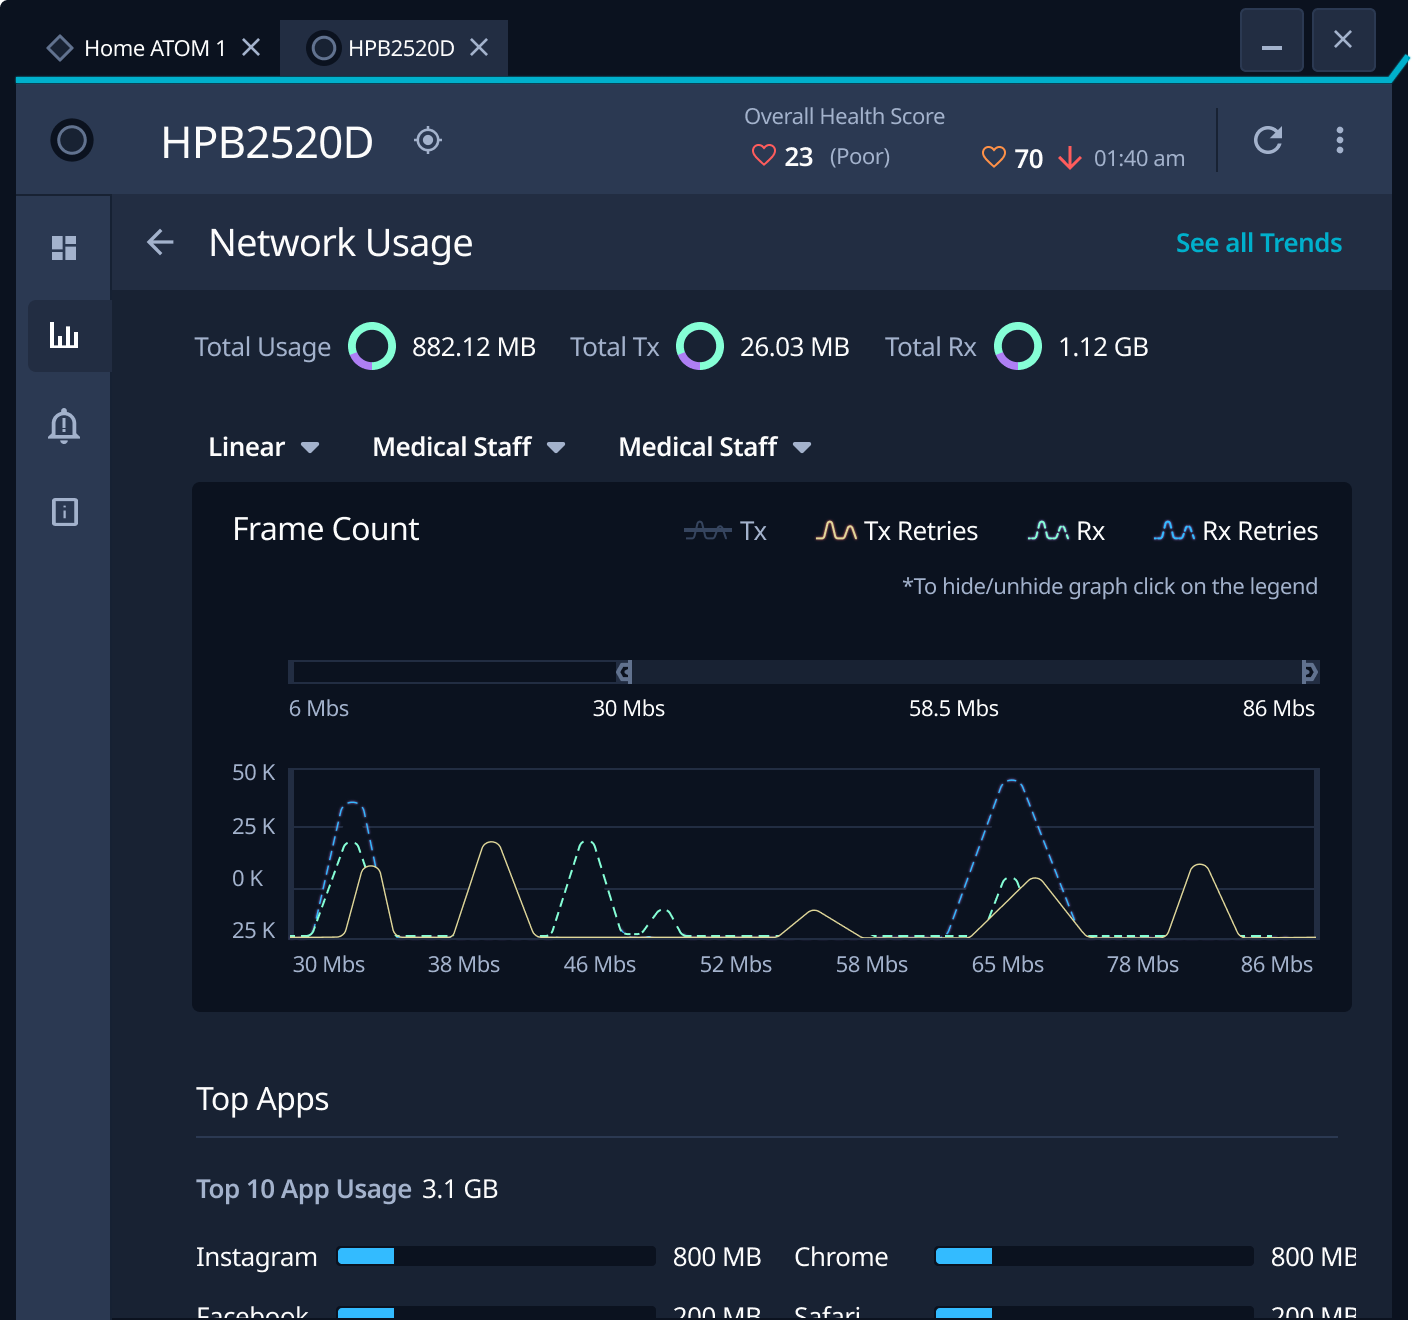
Dark NOC environments require high-contrast interfaces. Blue primary colors preserve night vision. Noto Sans provides character distinction at small sizes (0/O, 1/l/I). Color-blocked sections (Health Timeline purple, Alarms blue, Map orange) create spatial organization operators recognize in peripheral vision across 3–5 monitors.
Operators work 8–12 hour shifts under fatigue. Every design choice , color contrast, font size, spacing , accounts for physical environment and operational stress.
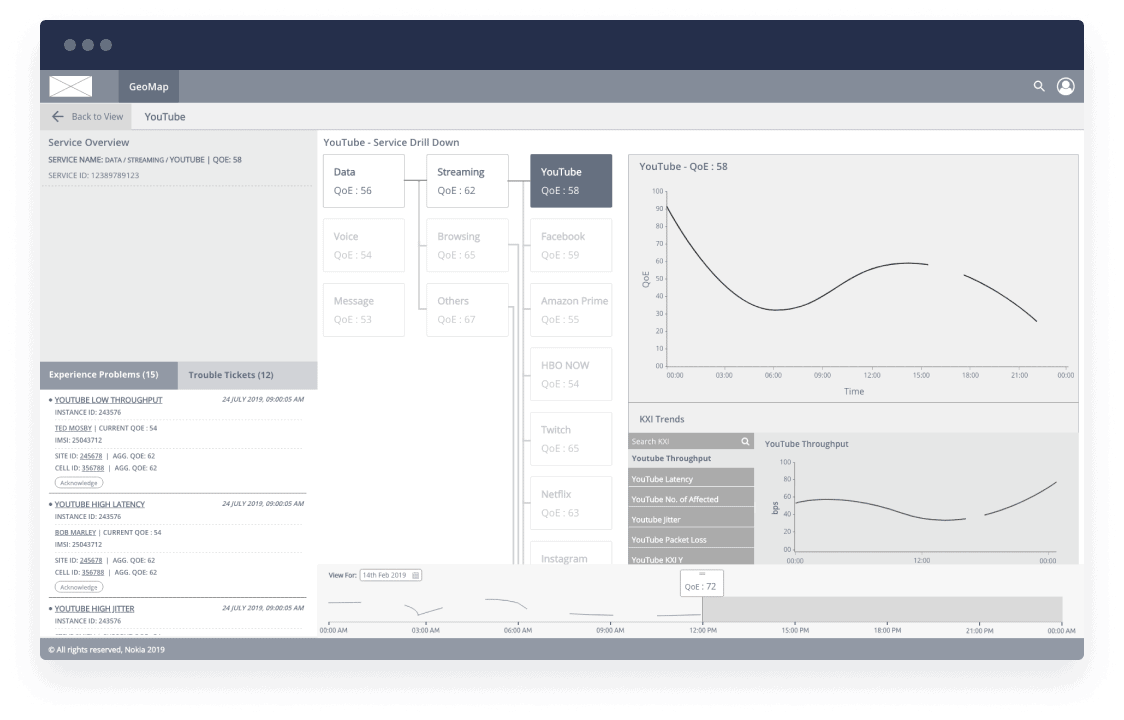
Nokia Experience allows us to proactively monitor our customers' experiences and take the actions needed, based on measured trends, and done through automation.